


Customer acquisition cost (CAC) is the total amount you have to spend, on average, to win one new paying customer – that is, marketing and sales costs divided by the number of newly won customers in the same period. On its own, CAC says little; only in relation to customer lifetime value (LTV) does it show whether your customer acquisition is profitable. But the most important catch comes last: a CAC is only ever as accurate as the tracking and attribution underneath it.
In this article you will learn what CAC is, how to calculate it, how it differs from CPO and CPA, why the LTV:CAC ratio is decisive, which levers reduce it – and why the CAC your tools report should be taken with a grain of salt.
Key Takeaways
- CAC = (marketing + sales costs) ÷ number of newly won customers. It measures what a new customer costs to acquire – not whether they pay off.
- CAC is not CPO or CPA: CPO and CPA count orders or actions, CAC counts real new customers.
- CAC only becomes meaningful in the LTV:CAC ratio. A common benchmark is 3:1 – as a rule of thumb from the SaaS world, not a law of nature.1
- Customer acquisition is getting more expensive: in B2B SaaS, blended CAC rose from 1.32 (2022) to 1.61 (2023) – about 22 percent more spend for the same new-customer revenue.2
- The most common mistake is not the formula but the data base: without complete tracking and reliable attribution, per-channel CAC is systematically distorted.
What is customer acquisition cost (CAC)?
Customer acquisition cost is the average amount you spend to win one new paying customer. It bundles everything that flows into new-customer acquisition: ad budget, costs for tools and tracking, agency or freelancer fees, a proportional share of marketing and sales salaries, and any discounts that trigger a first purchase.
Why the metric is so central: every scaling decision hangs on it. Only if you know what a new customer costs to acquire – and what they bring in over time – can you scale budget profitably instead of spending more in the dark.
The CAC formula: how to calculate CAC
The formula could not be simpler:
CAC = total acquisition costs ÷ number of newly won customers
Acquisition costs include, depending on how you view them: media and ad budget, tool and tracking costs, agency and freelancer costs, a proportional share of marketing and sales salaries, and first-purchase discounts. Two notes for a clean calculation:
- Keep the period consistent: costs and new customers have to refer to the same period, otherwise you distort the result – especially with longer purchase cycles.
- Count only new customers: repeat purchases do not belong in the denominator. Otherwise you flatter your CAC.
Calculate CAC: a worked example
A shop spends €20,000 on marketing and sales in one month and wins 200 new customers with it.
CAC = €20,000 ÷ 200 = €100 per new customer
The distinction between blended CAC and paid CAC matters. Blended CAC divides all acquisition costs by all new customers – including the ones won organically. Paid CAC looks only at the paid costs divided by the new customers won through paid. Blended CAC is the more honest full picture, paid CAC is more useful for channel steering – but only if the attribution of "which channel brought the customer" is actually correct. That is exactly where the problem lies later.
CAC vs. CPO vs. CPA: the distinction
Three metrics are constantly confused, even though they measure different things:
| Metric | Measures | Unit | Typical use |
|---|---|---|---|
| CAC | cost per newly won customer | new customer (person) | profitability of acquisition, LTV:CAC |
| CPO (cost per order) | cost per order | order (incl. existing customers) | e-commerce campaign steering |
| CPA (cost per action) | cost per defined action | action (lead, sign-up, purchase) | campaign and channel optimization |
In short: CPO and CPA count transactions or actions, CAC counts people – namely new customers. Mixing up the terms means comparing apples to oranges and making budget decisions on a skewed basis.
The decisive ratio: LTV:CAC
A CAC of €100 is, on its own, neither good nor bad. That is decided by customer lifetime value (LTV): how much contribution margin – revenue minus variable costs – does a customer bring over the entire relationship? The LTV:CAC ratio makes that tangible.
A frequently cited benchmark is 3:1 – a customer should bring in roughly three times what their acquisition cost. This rule goes back to the SaaS thought leader David Skok.1 The important caveat: it comes from the mature SaaS world and is a benchmark, not a law of nature. For early growth stages or other business models it is only a rough orientation – more of a floor than a target.
Thought of as a traffic light:
- below 1:1 – you are burning money; each new customer costs more than they bring.
- around 3:1 – healthy, sustainable acquisition.
- well above 3:1 – often a sign of under-investment: you could profitably spend more and grow faster.
Also relevant is the CAC payback period – the time until a customer has earned back their acquisition cost. It varies strongly by contract value and business model; in SaaS the range runs from a few months for small contracts to well over a year for large ones.3 The shorter the payback period, the less capital your growth ties up.
What is a good CAC?
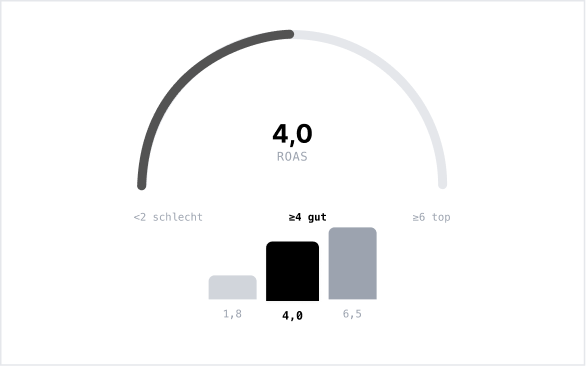
There is no universally "good" CAC. It depends on your margin, your LTV and your payback tolerance. A CAC of €100 is excellent at €400 LTV and a loss-maker at €120 LTV. As with ROAS: the sensible target follows from your own economics, not from a rule of thumb. For how to derive an efficiency target cleanly from your margin, read the article on a good ROAS.
For rough orientation: in a US analysis, the average e-commerce CAC ranges from about US$53 to US$91 depending on the vertical.8 Such figures cannot be transferred one-to-one to the DACH market, and they never replace the calculation with your own margin and your own LTV.
Reducing CAC: the most effective levers
Reducing CAC rarely means "simply buy cheaper". The biggest levers lie elsewhere:
- Steer budget to where it actually brings new customers: most budgets are misallocated because channel impact is measured wrong. Shifting into the high-impact channels lowers blended CAC fastest – provided you measure impact correctly.
- Funnel and CRO: a higher conversion rate at the same traffic lowers CAC directly. Landing pages, checkout and load time are often the cheapest levers.
- Increase retention and LTV: a higher LTV widens the room you can afford for acquisition – and improves the LTV:CAC ratio without CAC itself having to fall.
- Channel efficiency and creatives: better creatives and audiences lower click and conversion costs in the paid channels.
- Separate new and existing customers: anyone unknowingly wasting budget on existing customers pays too high a CAC. Separating them reveals the true new-customer CAC.
The common thread: almost every one of these levers assumes that you measure the impact of your channels correctly in the first place. Which brings us to the actual problem.
Why your CAC is misleading without clean attribution
Here comes the point most guides leave out: the CAC formula is trivial – the numbers you put into it are not. Two figures are systematically distorted today.
First, the new customers in the denominator. Since Apple's App Tracking Transparency (ATT) and the consent requirement, a substantial share of conversions is missing from standard reports. In Germany, the ATT opt-in rate was just 47 percent according to AppsFlyer in early 20244; Meta put the revenue impact of ATT for 2022 alone at roughly US$10 billion.5 Missing or only modeled conversions mean your CAC is either overstated or attributed to the wrong channel.
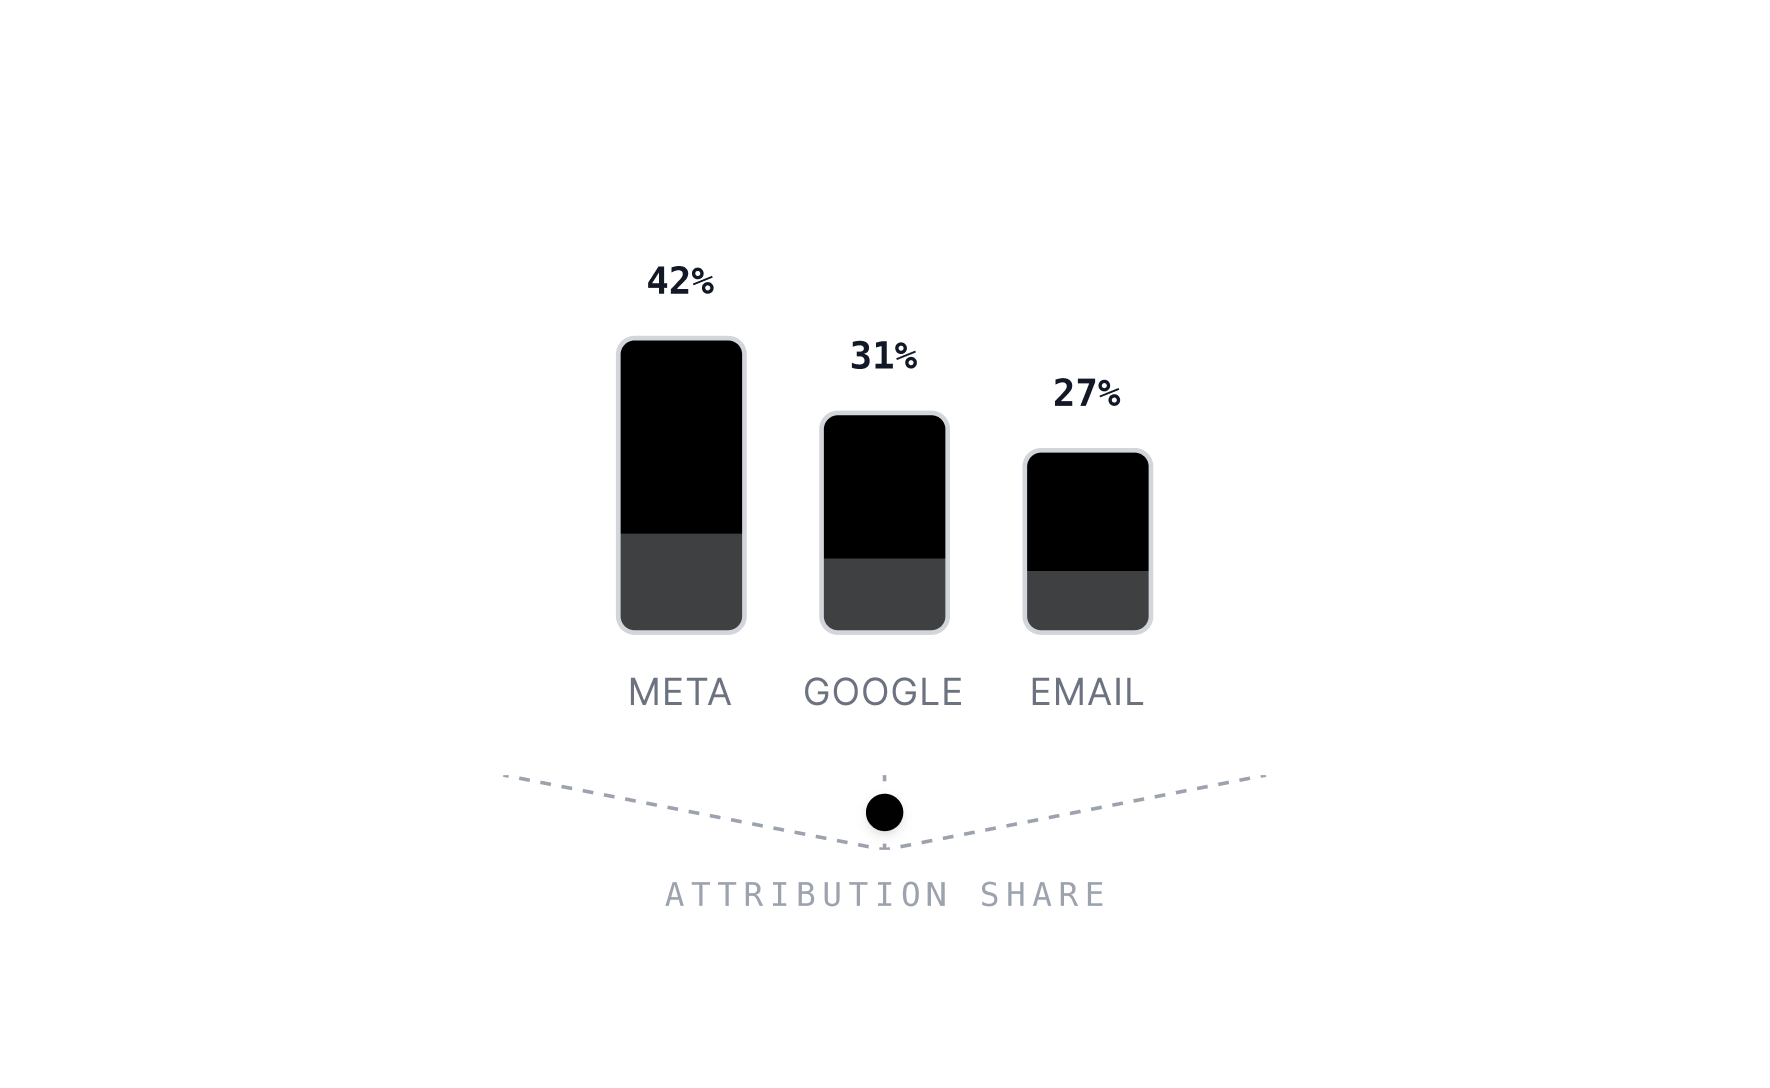
Second, the attribution. Crediting new customers to the last contact via last click makes some channels (e.g. brand search) look artificially cheap and others (e.g. awareness campaigns) artificially expensive. The result: you cut exactly the channel that actually kicks off the new customers.
You know the outcome: two tools show two CACs, and the budget decision becomes a guessing game. That many overestimate their own data is documented – according to Nielsen, only 38 percent of marketers measure their ROI consistently across channels, while 84 percent feel highly confident in their measurement.6 For how to weigh channels fairly instead of trusting the last click alone, read the pillar on marketing attribution.
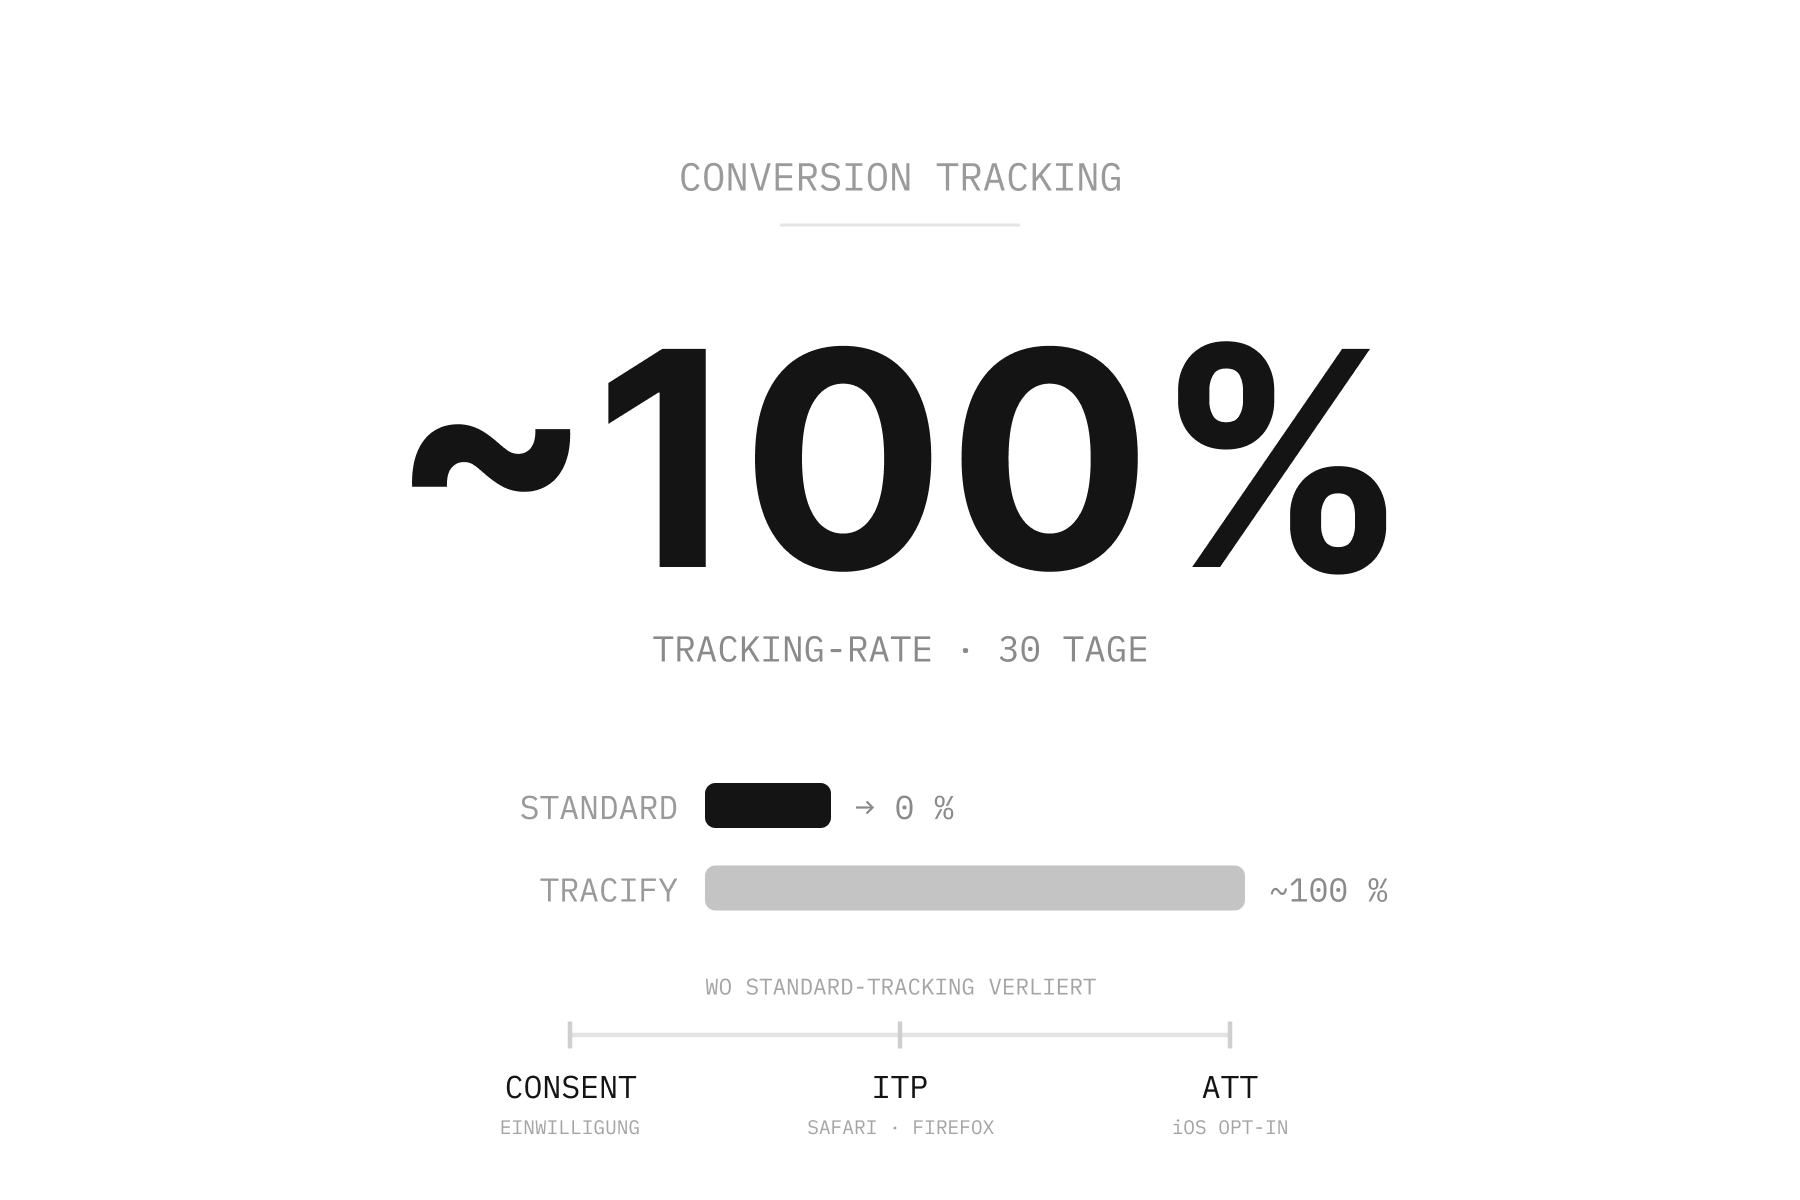
This is exactly where Tracify comes in: instead of relying on consent-requiring cookies, Tracify uses a patented, consent-free hybrid tracking – according to Tracify, this brings up to 40 percent more relevant data points into the system, at a tracking rate of nearly 100 percent over 30 days.7 On this complete basis, the behavior-based AI attribution weighs every touchpoint by its true contribution – so you get a per-channel CAC that is based on complete data instead of the last click. In the Profit & Loss Dashboard you see CAC, costs and contribution margin together. What that delivers in practice is shown by the petcare shop Dogs n Tiger: an 8 percent lower CAC through end-to-end analysis of the customer journey.7
Frequently asked questions about customer acquisition cost
What is customer acquisition cost (CAC)?
CAC is the average amount you spend to win one new paying customer. It covers marketing and sales costs and is divided by the number of newly won customers in the same period.
How do you calculate CAC?
CAC = total acquisition costs ÷ number of newly won customers. €20,000 in marketing and sales costs with 200 new customers gives a CAC of €100 per new customer. Important: same period for costs and customers, count only new customers.
What is the difference between CAC, CPA and CPO?
CAC measures the cost per newly won customer. CPA measures the cost per defined action (e.g. lead or sign-up), CPO the cost per order – including from existing customers. CAC counts people, CPO and CPA count actions or orders.
What is a good LTV:CAC ratio?
A rule of thumb is around 3:1: a customer should bring in roughly three times what their acquisition costs. Below 1:1 acquisition is loss-making; well above 3:1 often points to under-investment. The benchmark comes from the SaaS world and is an orientation, not a fixed target.
How can I reduce my CAC?
The most effective levers are better budget allocation to the truly effective channels, higher conversion rates (CRO), more retention and LTV, and more efficient creatives. The prerequisite is correct attribution – otherwise you optimize on distorted per-channel CACs.
Conclusion
Customer acquisition cost is one of the most important metrics in customer acquisition – but only as good as the numbers you put into it. The formula is simple, the interpretation via the LTV:CAC ratio is decisive, and the real lever usually lies in better budget allocation.
But that requires a CAC that is correct. In a market with incomplete platform data and last-click distortion, reliable tracking and fair attribution are the prerequisite for "a good CAC" being more than a nice number in a report. This is exactly where Tracify comes in.
- David Skok – SaaS Metrics 2.0, ForEntrepreneurs / Matrix Partners (origin of the 3:1 LTV:CAC benchmark): forentrepreneurs.com/saas-metrics-2
- Benchmarkit – 2024 SaaS Performance Metrics Report (blended CAC ratio 1.32 → 1.61): benchmarkit.ai/2024benchmarks
- Benchmarkit – 2024 SaaS Performance Metrics Report (CAC payback period by contract value): benchmarkit.ai/2024benchmarks
- AppsFlyer – ATT opt-in rates, three years on (04/26/2024): appsflyer.com/company/newsroom/pr/att-data-findings
- CNBC – Facebook says Apple iOS privacy change will cost $10 billion this year (02/02/2022): cnbc.com/2022/02/02/facebook-says-apple-ios-privacy-change-will-cost-10-billion-this-year.html
- Nielsen – 2024 Annual Marketing Report (only 38% measure ROI across channels, 84% high confidence in their own measurement): nielsen.com/news-center/2024/…annual-marketing-report
- Tracify – product information, metrics and Dogs n Tiger case study (first-party, as of 2026): tracify.ai
- First Page Sage – Average CAC for eCommerce Companies (2025, US agency panel, not audited – rough orientation only): firstpagesage.com/reports/average-cac-for-ecommerce-companies