


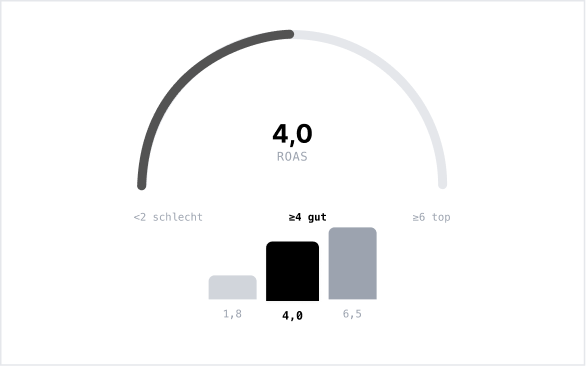
A good ROAS is any ROAS above your break-even ROAS, and that follows from your margin, not from a fixed number. The break-even ROAS is 1 divided by your contribution margin: at a gross margin of roughly 33 percent, which is typical in retail, it sits at around 3.0. A "good" ROAS lies above that. The often-quoted 4:1 rule of thumb is nothing more than the break-even at a 25 percent margin, not an industry-wide standard. So what matters is not a universal value but your own target figure, plus the question of whether the number is even based on reliable data.
In this article you will learn how to calculate ROAS, how to determine your individual target value, why the 4:1 rule is a myth, and why the ROAS that Meta or Google shows you should be taken with a grain of salt.
Key Takeaways
- ROAS = revenue ÷ ad spend. It tells you how much revenue comes back per advertising euro, not whether you turn a profit.
- A universally "good" ROAS does not exist. The sensible target is your break-even ROAS plus a buffer for fixed costs and profit.
- Break-even ROAS = 1 ÷ contribution margin. At roughly a 33 percent margin it sits at around 3.0.
- The 4:1 rule is only the break-even at a 25 percent margin, not an empirical benchmark. Real median ROAS in 2025 was more like 2 to 3.
- The ROAS reported by Meta and Google has been full of gaps since ATT and consent requirements. A good ROAS built on bad data is worthless.
What is ROAS?
ROAS stands for Return on Ad Spend, meaning the revenue you get back for every advertising euro you invest. It is the standard metric in every ads account and answers one single question: how much revenue does my ad budget generate?
What matters is what ROAS does not answer: whether the advertising pays off. Because revenue is not profit. A ROAS can look brilliant and the campaign can still run at a loss once cost of goods, shipping, returns, and fees are deducted. That is exactly why it is not enough to just calculate ROAS, you also have to evaluate it in relation to your margin.
Calculate ROAS: formula and example
The formula could not be simpler:
ROAS = revenue from advertising ÷ ad spend
A worked example: a campaign generates €10,000 in revenue and costs €2,500 in media budget.
ROAS = €10,000 ÷ €2,500 = 4.0 (or 400%)
A ROAS of 4.0 means: for every euro of ad budget, 4 euros in revenue come back. But whether that is good or bad, the number alone does not tell you, because it does not know your cost structure. Two notes for a clean calculation:
- Net, not gross: Calculate with net revenue (excluding VAT), otherwise you overstate the ROAS by the tax rate.
- All ad spend: Depending on how you view it, the media budget also includes agency and tool costs. Whatever you include has to be consistent across all campaigns.
What is a good ROAS?
The honest answer: there is no universally valid "good" ROAS. Anyone who gives you a fixed number without knowing your margin is guessing. The only sensible yardstick is your break-even ROAS, the point at which a campaign climbs out of the loss zone. And that can be calculated exactly:
Break-even ROAS = 1 ÷ contribution margin
Example: at a contribution margin of 33 percent, your break-even is 1 ÷ 0.33 = roughly 3.0. A campaign with a ROAS of 3.0 at this margin therefore makes neither a gain nor a loss, even though a ROAS of 3 passes as "good" in most reporting. A truly good ROAS lies above your break-even, with enough buffer for the proportional fixed costs and the profit you want to achieve.
This overview shows how strongly the target value depends on the margin:
| Contribution margin | Break-even ROAS | Meaning |
|---|---|---|
| 10% | 10.0 | thin margins need a high ROAS |
| 20% | 5.0 | — |
| 25% | 4.0 | this is exactly where the "4:1 rule" sits |
| 33% | 3.0 | avg. retail margin (Damodaran, 2026) |
| 50% | 2.0 | — |
| 60% | 1.7 | high margins get by with a low ROAS |
To put the 33 percent row in context: the dataset from Aswath Damodaran (NYU Stern, as of January 2026) shows an average gross margin of roughly 33 percent and a net margin of only about 5.6 percent for retail.1 If you calculate the break-even against the net margin, you even need a ROAS beyond 15. Which margin is the right one depends on which costs you want to manage, but one thing is clear: without your margin, a ROAS says nothing about profitability.
The myth of the "4:1 ROAS"
Hardly any metric is as fused with a rule of thumb as ROAS is with the 4:1 rule: a good ROAS is supposedly 4, so 400 percent. This number is stubbornly persistent, but it has no solid basis.
It is often attributed to a Nielsen study. The relevant 2016 analysis, however, names no universal 4:1 value at all, but very different returns depending on product category, medium, and brand size, and it explicitly stresses that there is no single benchmark.2 The "4:1 rule" is in truth nothing other than the break-even ROAS at a 25 percent margin (1 ÷ 0.25 = 4), retroactively declared the supposed target. For any shop whose margin deviates from 25 percent, it is simply the wrong number.
It does not hold up empirically either: various benchmark analyses for 2025 put the median ROAS in e-commerce more in the range of 2 to 33, clearly below the much-cited 4. (These values come from vendor panels and are not an audited standard, but they work as a reality check.) The lesson from this is not "aim for 2.5 instead of 4", but rather: drop the rules of thumb and calculate your own break-even.
Why your reported ROAS is often wrong
Even the perfectly calculated target value is useless if the revenue figure in the numerator is not right. And that is exactly the norm since the data-privacy upheavals: the ROAS that Meta or Google shows you is based on incomplete, partly modeled data.
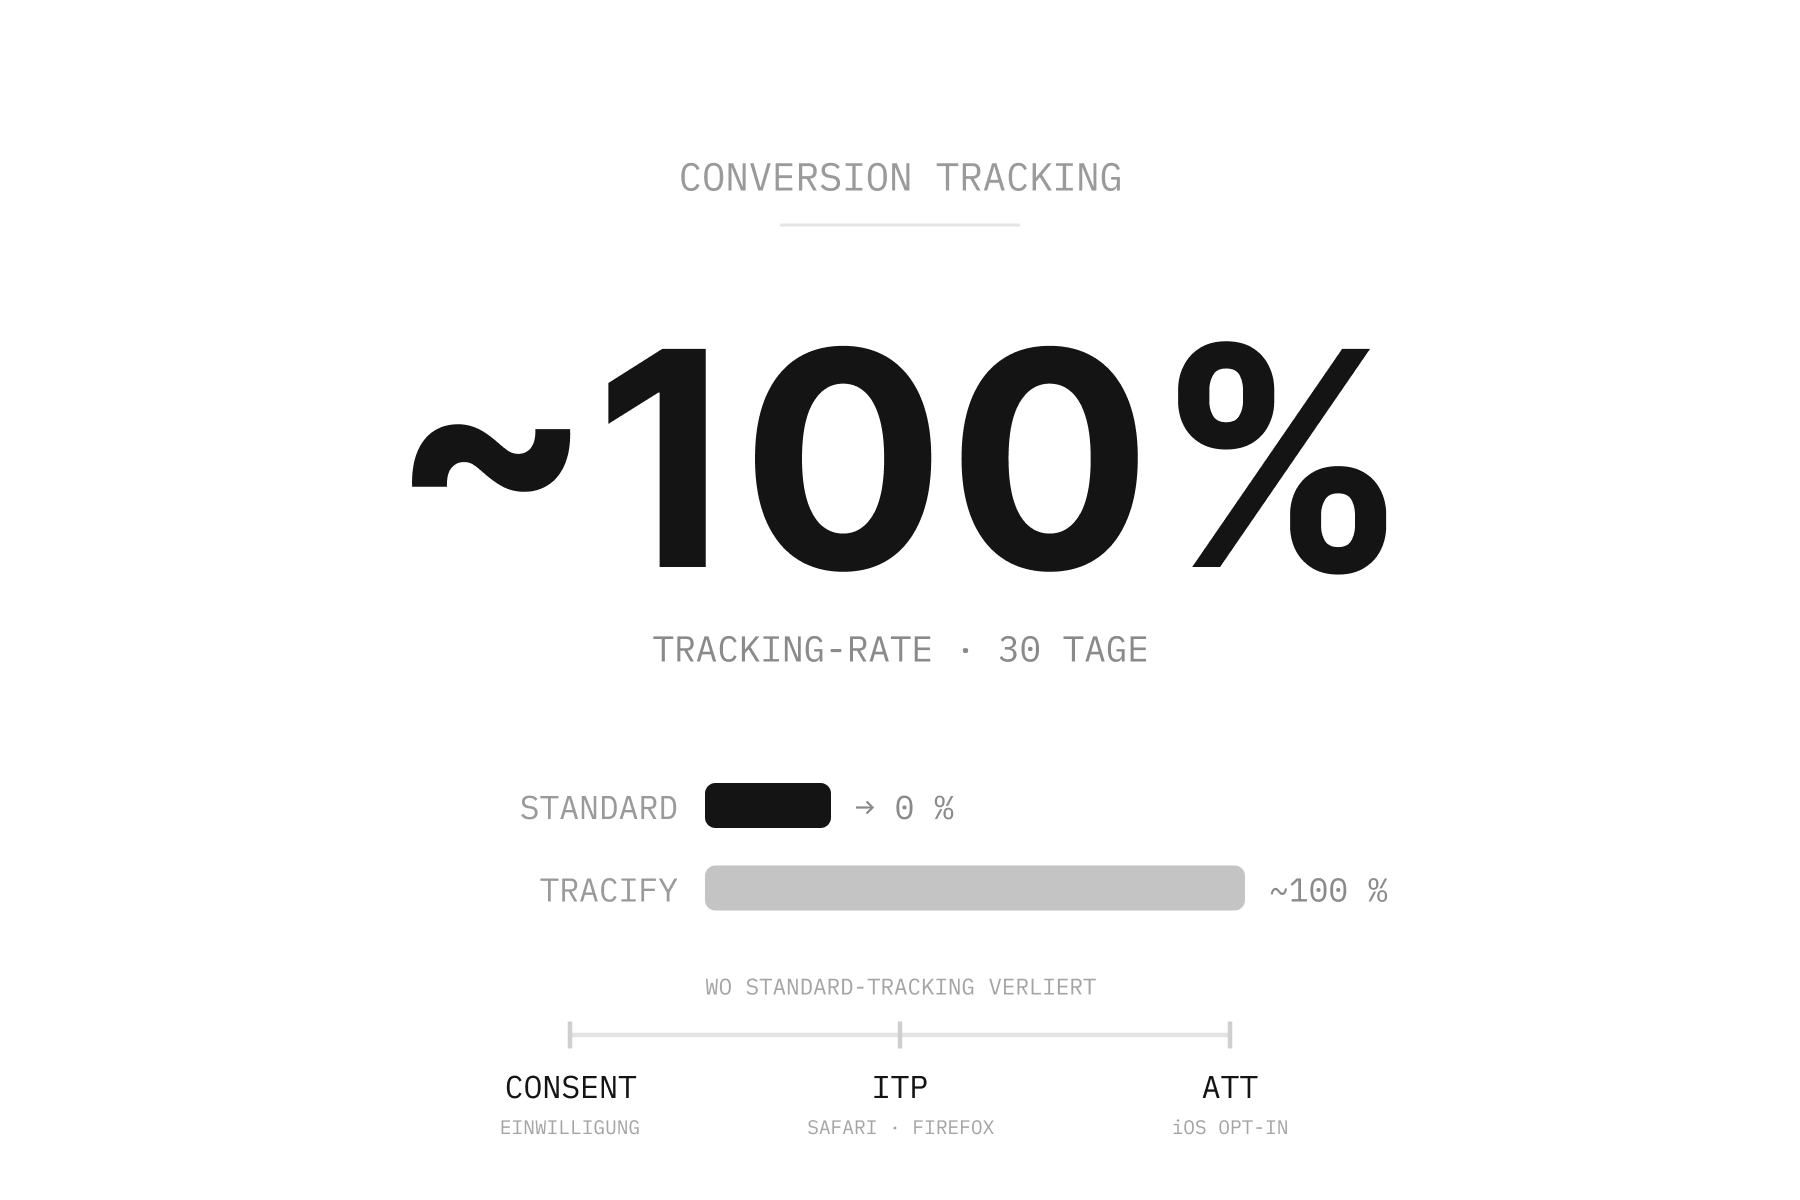
Since Apple's App Tracking Transparency (ATT) and the consent requirement, the platforms no longer see a significant share of conversions cleanly. In Germany, the ATT opt-in rate was just 47 percent according to AppsFlyer in early 20245, so roughly half of iOS users can no longer be attributed on an ID basis. Meta put the revenue impact of ATT for 2022 alone at roughly US$10 billion6 and explicitly cited poorer measurability as the cause.
That this is not just reporting cosmetics is shown by a study published in 2025 in the journal Management Science: ATT demonstrably reduced both the effectiveness and the measurability of advertising. According to the research, affected e-commerce retailers recorded partly double-digit revenue declines compared with less affected competitors, and smaller shops were hit hardest.4 When a good share of conversions is missing or only estimated, you are measuring a ROAS built on sand.
A common misconception is that the problem is the "end of the cookie". In fact, Google has scrapped the removal of third-party cookies in Chrome. The data gap is not torn open by a single browser, but by the combination of consent requirements, Apple's ATT, and cookie blocking in Safari and Firefox. The gap is real, and it sits underneath every ROAS figure you pull from the Ads Manager.
How to put your ROAS on reliable data
A good ROAS target value is one half, reliable data the other. This is exactly where Tracify comes in: first close the data gap, then measure and evaluate cleanly.
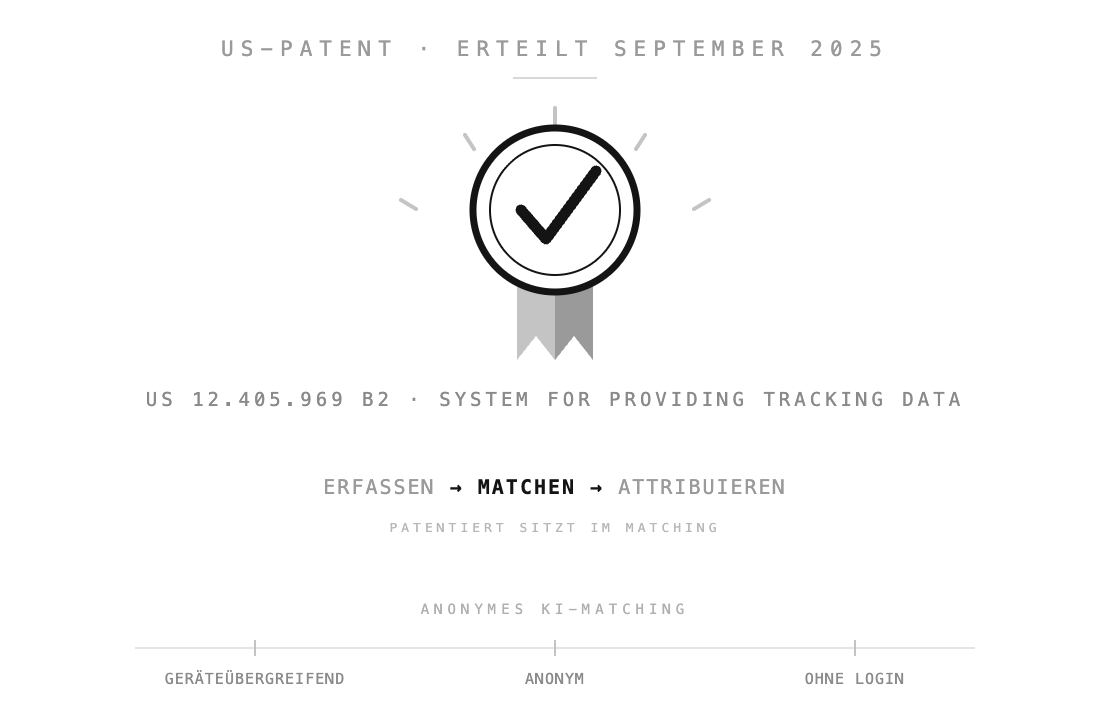
Instead of relying on consent-requiring cookies, Tracify captures customer journeys through a patented, consent-free hybrid tracking that is certified as consent-free by the BISG and is processed exclusively on German servers. According to Tracify, this puts up to 40 percent more relevant data points into the system, at a tracking rate of nearly 100 percent over 30 days, while classic setups lose ground toward zero over the same period.7 On this complete basis, the AI attribution delivers a ROAS that is not built on half the data.
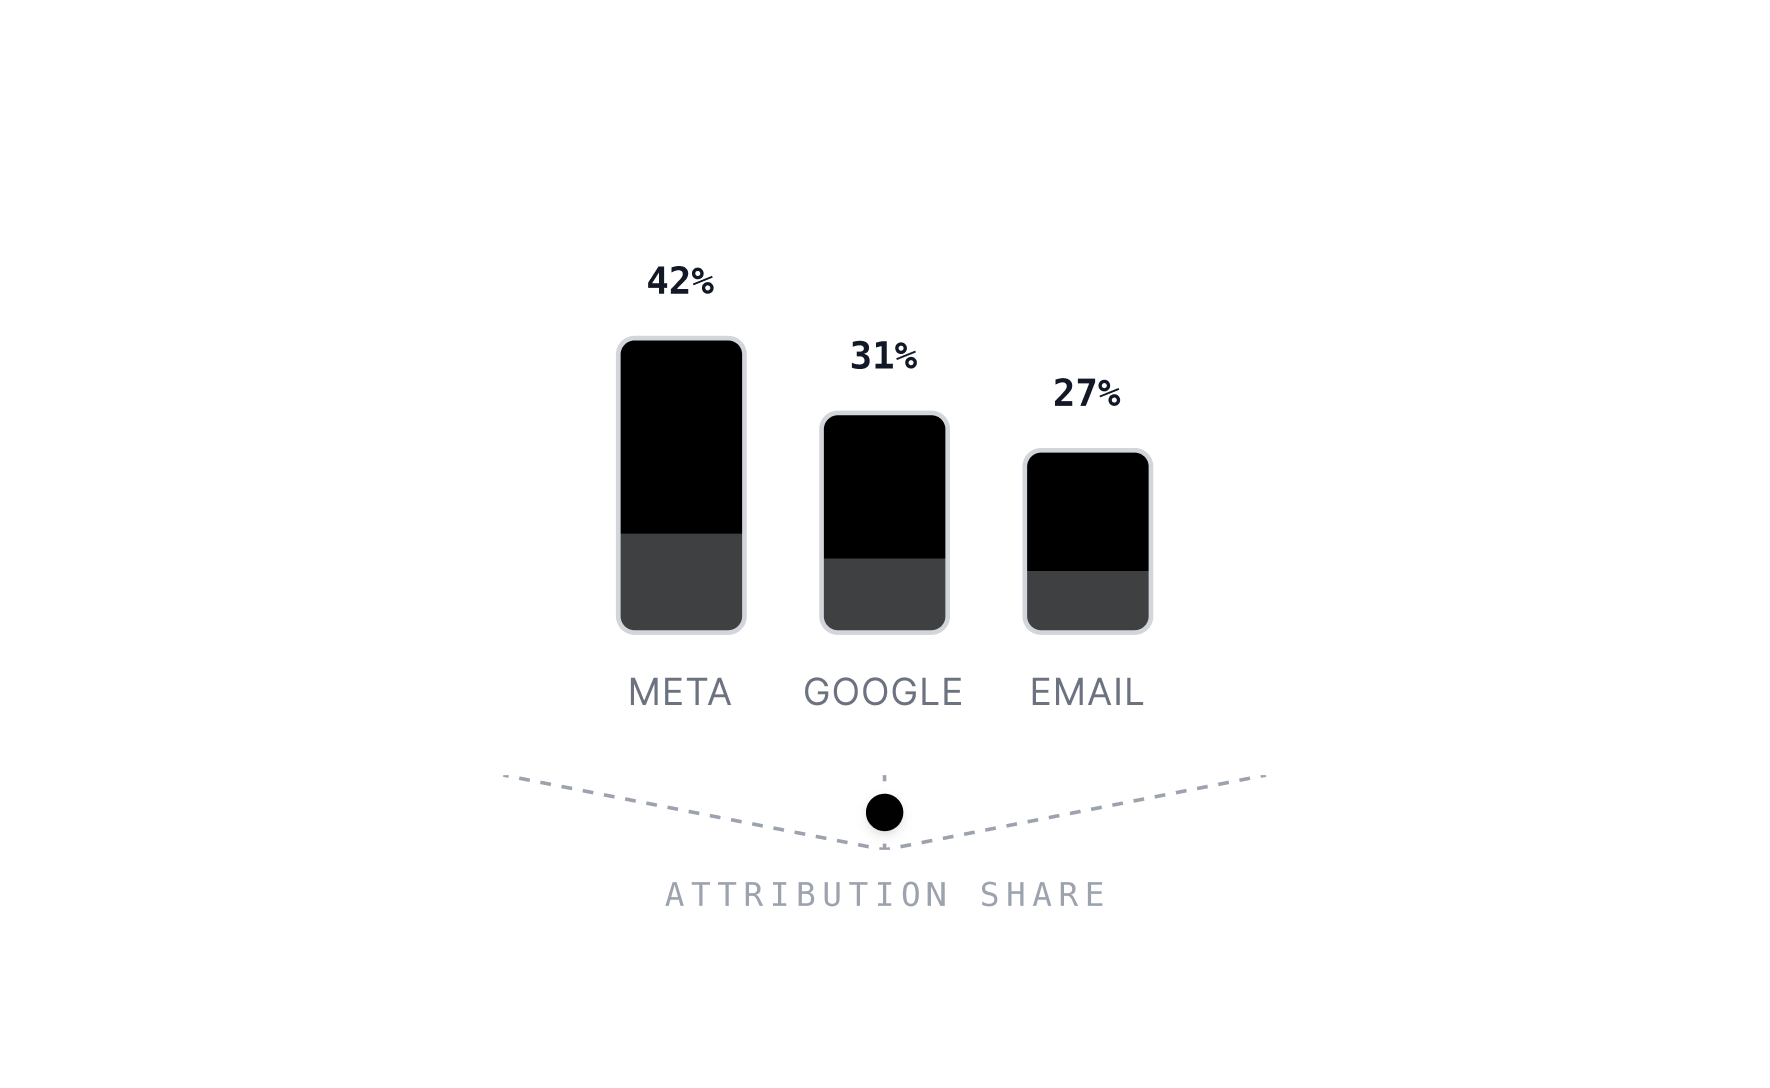
And because ROAS alone only shows revenue, the Profit & Loss Dashboard brings revenue and costs together, so you see directly whether a campaign is above your break-even. What that delivers in practice is shown by the customer figures: Juniqe increased its MER by 48 percent according to Tracify, Travelcircus halved its CPO on Meta.7 If, instead of a flattering ROAS, you want to know which euro actually brings profit, you combine Tracify's AI attribution with the GDPR-compliant hybrid tracking that supplies the data in the first place.
Frequently asked questions about ROAS
What is a good ROAS?
A good ROAS lies above your break-even ROAS. The break-even is 1 divided by your contribution margin, so at roughly a 33 percent margin that is about 3.0. Anything above that is profitable. There is no universally "good" value, it depends on your margin and your profit target.
How do you calculate ROAS?
ROAS = revenue from advertising ÷ ad spend. €10,000 in revenue at a €2,500 media budget gives a ROAS of 4.0, or 400 percent. For a clean result, calculate with net revenue and keep the ad spend you include consistent.
What does a ROAS of 4 mean?
For every advertising euro, 4 euros in revenue come back. Whether that is profitable depends on the margin: at a 25 percent margin, a ROAS of 4 is just the break-even, at a 50 percent margin it is long since profitable.
What is the difference between ROAS and POAS?
ROAS measures the revenue per advertising euro, POAS the profit. Two campaigns with an identical ROAS can be completely different in profitability, depending on the margin of the product sold. For budget decisions, POAS is therefore more meaningful.
Is a high ROAS always good?
Not necessarily. A very high ROAS often points to a budget that is too small, in which case you are leaving profitable growth on the table. And a high ROAS on incomplete data is deceptive: it only measures what the platform can still see.
Conclusion
ROAS is a useful efficiency metric, but not a verdict on profitability, and certainly not a fixed target number. A good ROAS is always relative to your margin: calculate your break-even ROAS (1 ÷ contribution margin), add a buffer, and ignore rules of thumb like the 4:1 rule, which is usually just wrong for your shop.
And before you evaluate your ROAS, make sure the number is even correct. In a market with incomplete platform data, reliable tracking is the prerequisite for "a good ROAS" being more than a nice number in the Ads Manager. This is exactly where Tracify comes in.
- NYU Stern / Aswath Damodaran – Operating and Net Margins by Industry (Retail General; as of January 2026): pages.stern.nyu.edu/~adamodar/New_Home_Page/datafile/margin.html
- Nielsen – Benchmarking Return on Ad Spend: Media Type & Brand Size Matter (2016): nielsen.com/insights/2016/benchmarking-return-on-ad-spend-media-type-brand-size-matter
- Upcounting – Average E-Commerce ROAS (2025, vendor panel, not audited): upcounting.com/blog/average-ecommerce-roas
- Aridor, Che, Hollenbeck, Kaiser, McCarthy – Evaluating the Impact of Privacy Regulation on E-Commerce Firms: Evidence from Apple's App Tracking Transparency, Management Science (2025): pubsonline.informs.org/doi/10.1287/mnsc.2024.06600
- AppsFlyer – ATT opt-in rates, three years on (26.04.2024): appsflyer.com/company/newsroom/pr/att-data-findings
- CNBC – Facebook says Apple iOS privacy change will cost $10 billion this year (02.02.2022): cnbc.com/2022/02/02/facebook-says-apple-ios-privacy-change-will-cost-10-billion-this-year.html
- Tracify – Product information and metrics (first-party, as of 2026): tracify.ai