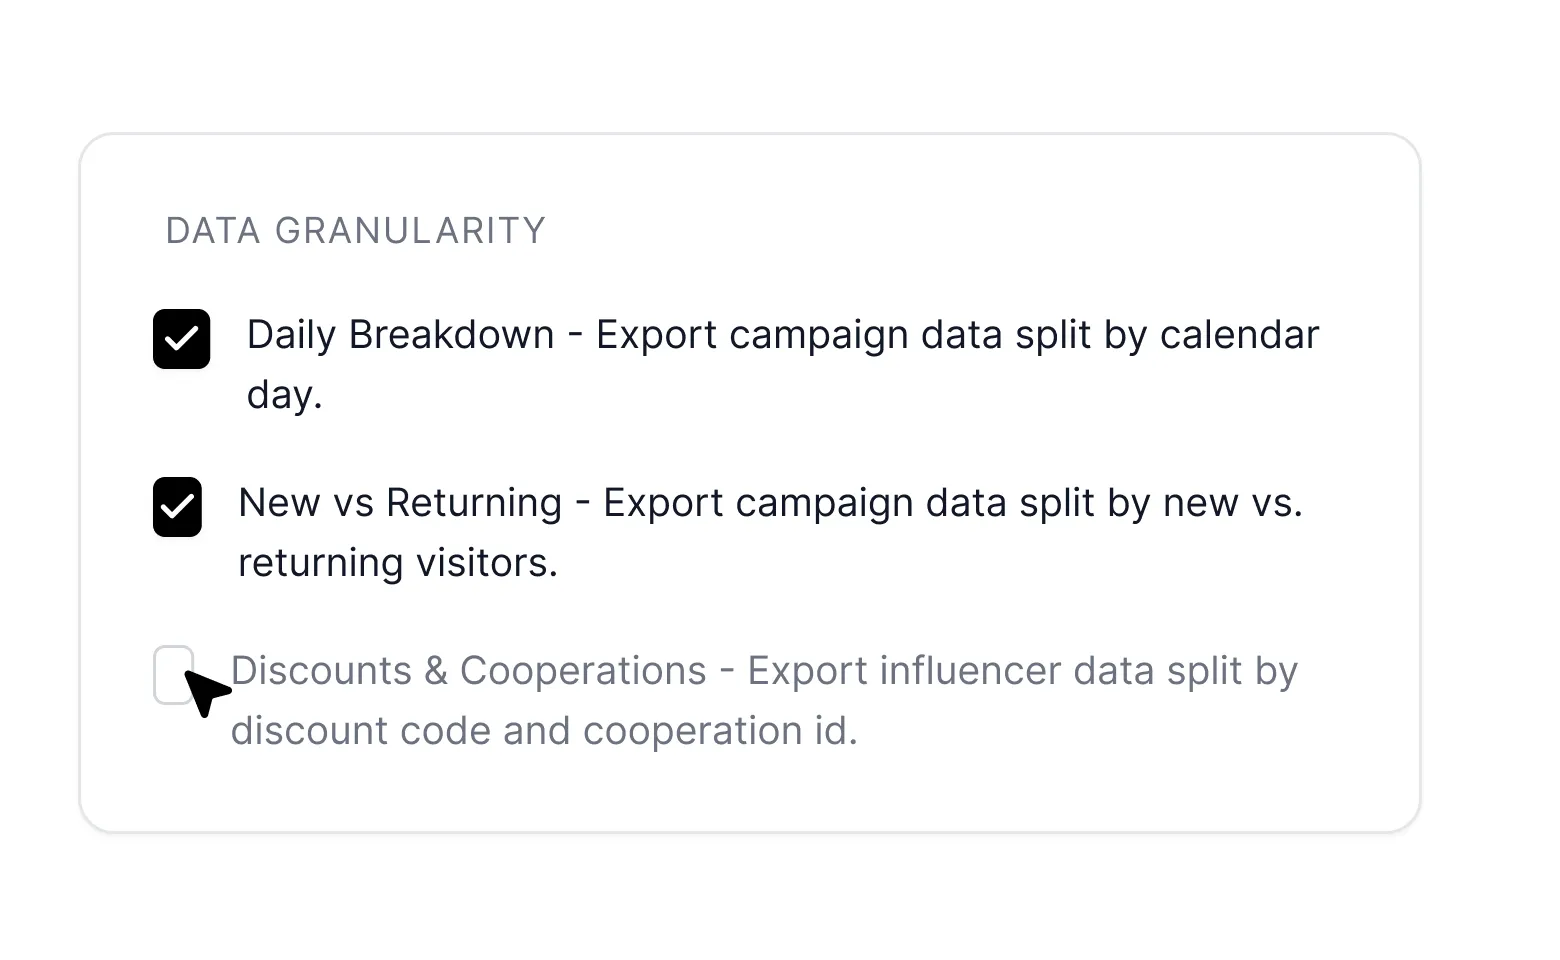
Granular data breakdown
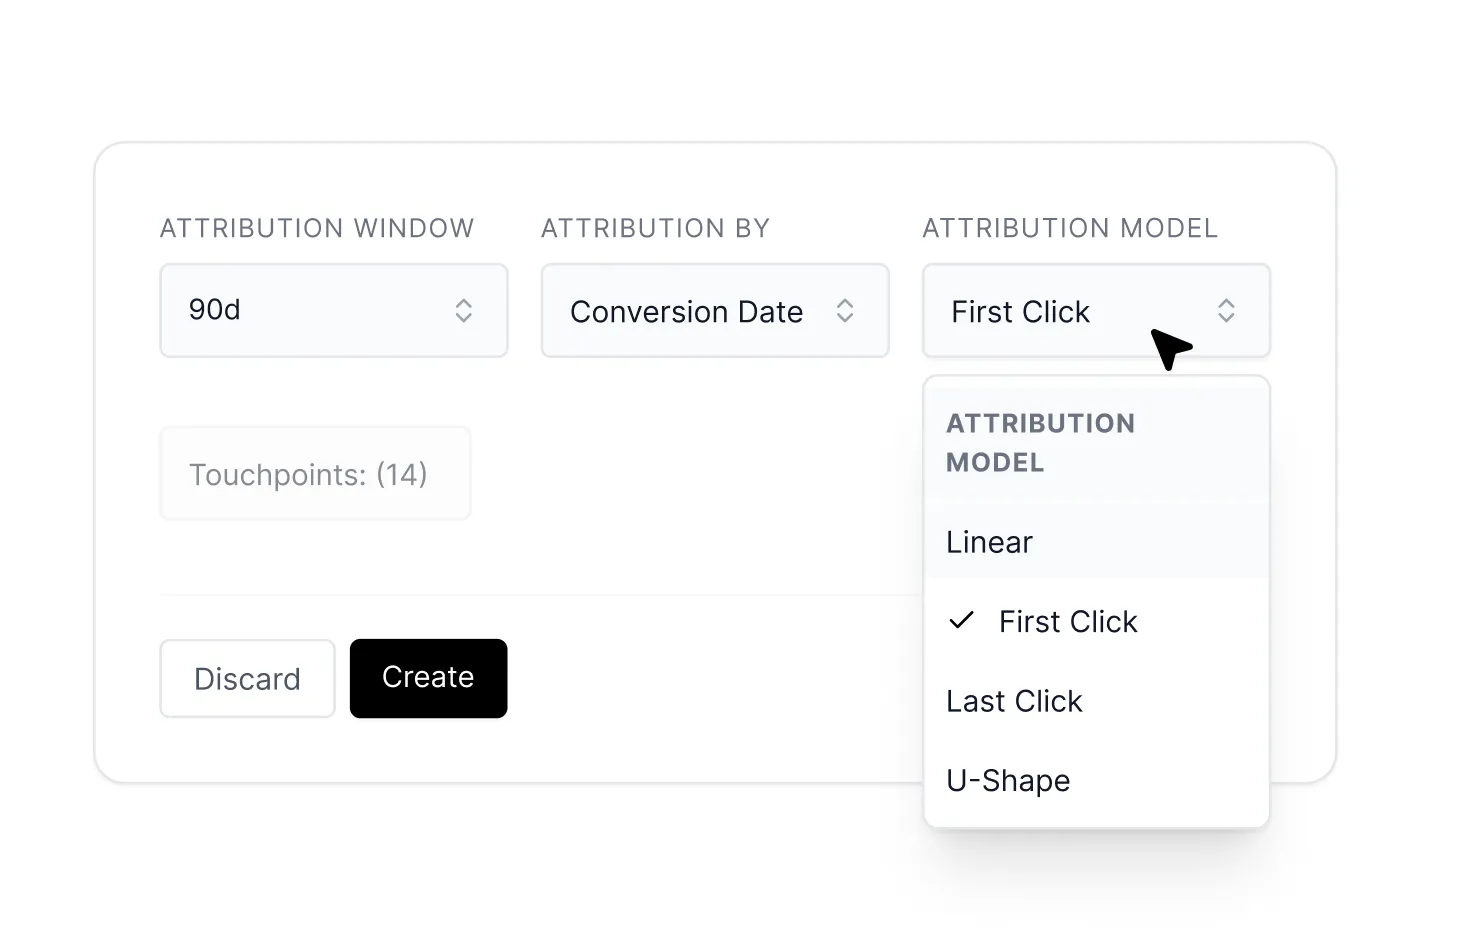
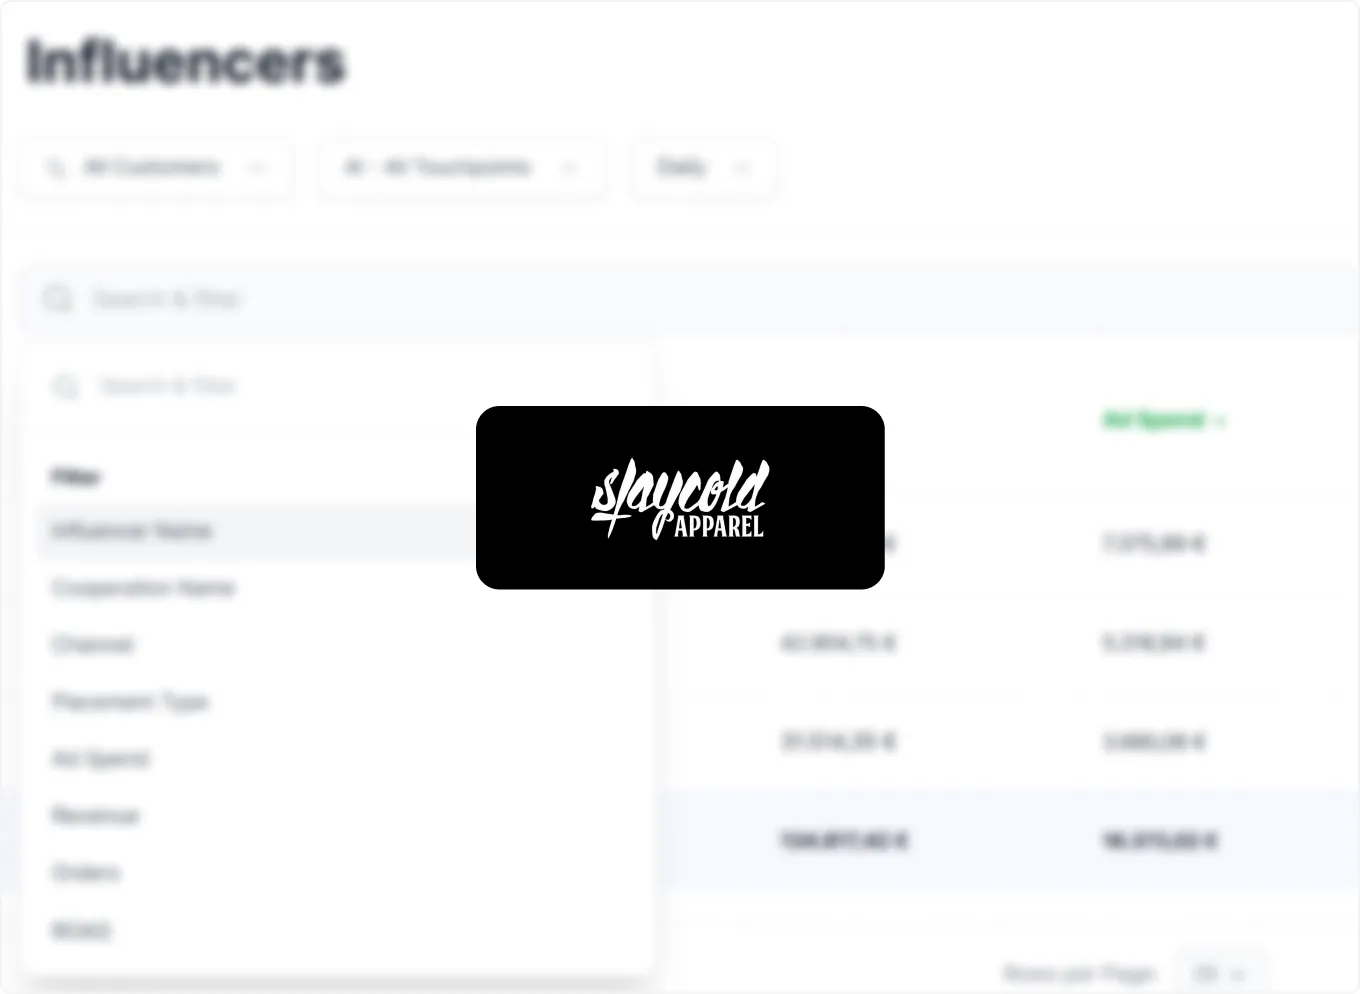
Improve your decision making with data breakdown options such as daily performance analysis, the distinction between new and returning customers and the influence of your influencer discounts and collaborations.

.webp)
.webp)
.webp)

.webp)
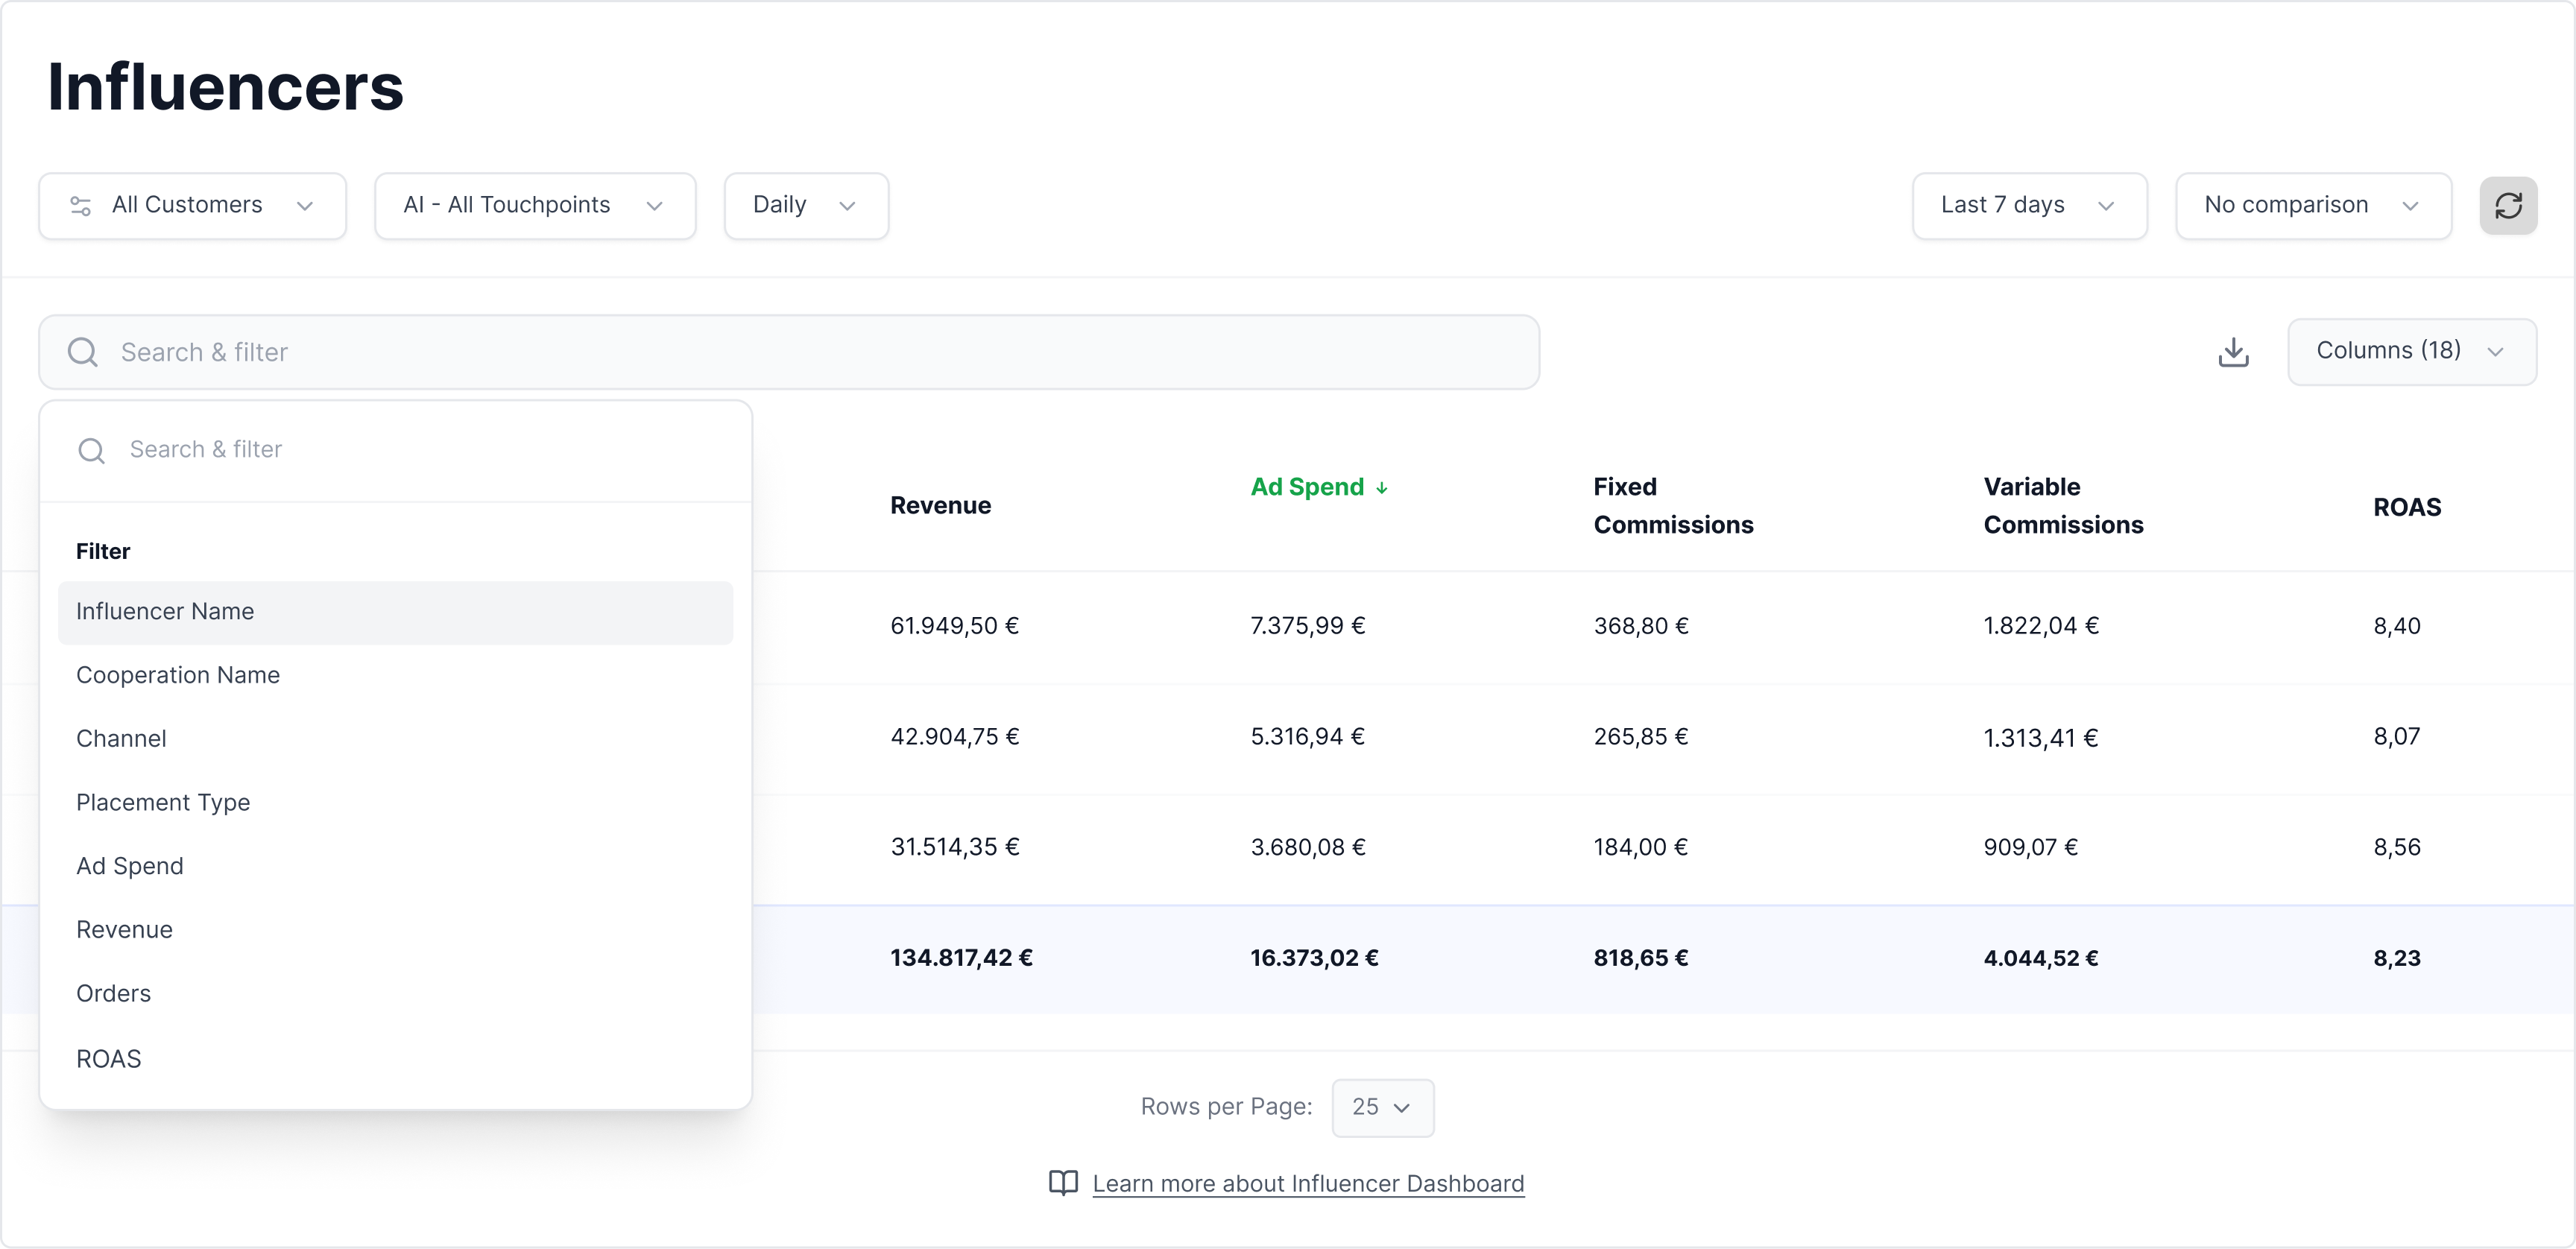
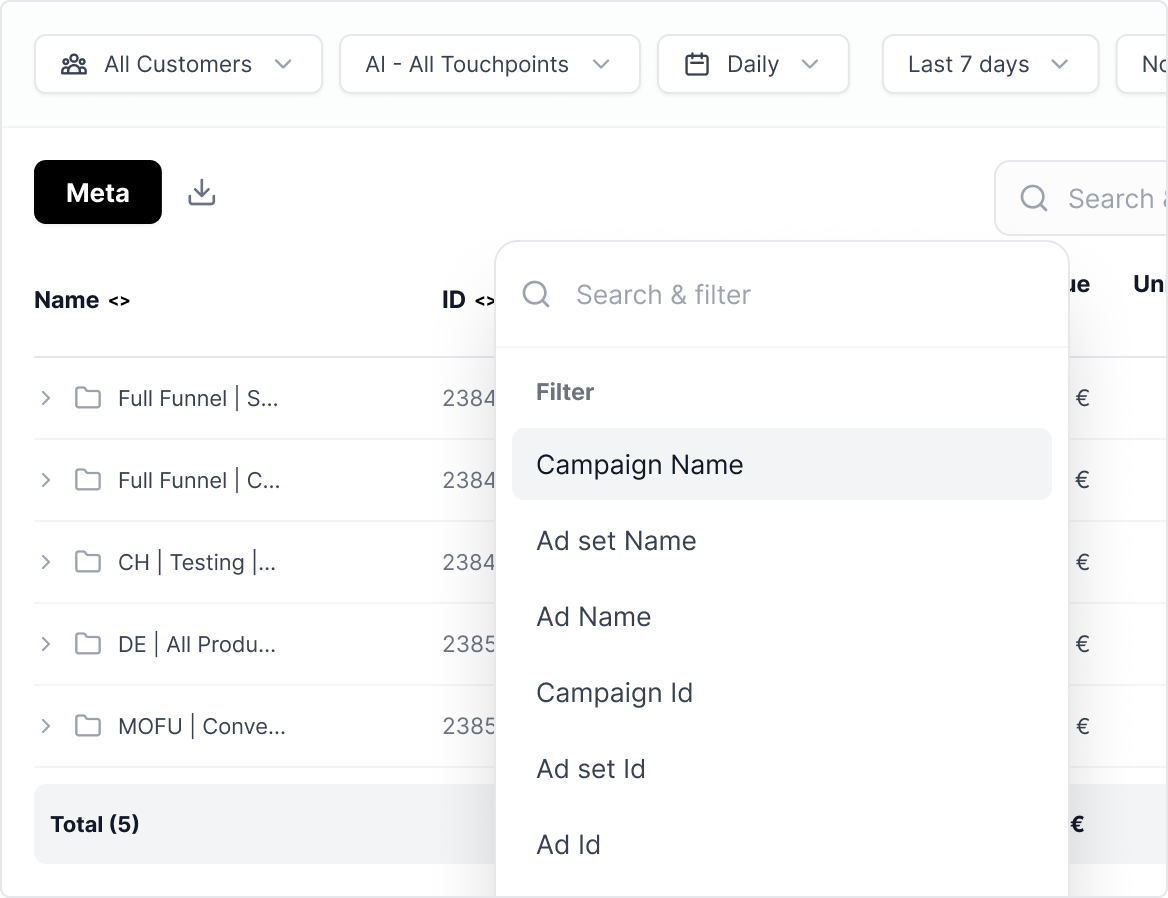
Yes. Filters can be combined via AND logic so you can narrow down your dashboards by several hard criteria at once — for example, ROAS above a certain threshold AND budget above a defined amount AND a specific campaign name. That lets you spot winner and loser ads instantly, even in large, complex ad accounts.
Yes — you can save your most important filter combinations and pull them up again with a single click. That eliminates repetitive configuration work in daily reporting and saves measurable time, especially in accounts with lots of campaigns.
You can compare any analysis window directly to the previous period. Tracify shows both the percentage change and the absolute difference in real numbers. Color indicators — green for positive, red for negative shifts — let you spot scaling opportunities and risks at a glance, before they hit your budget.