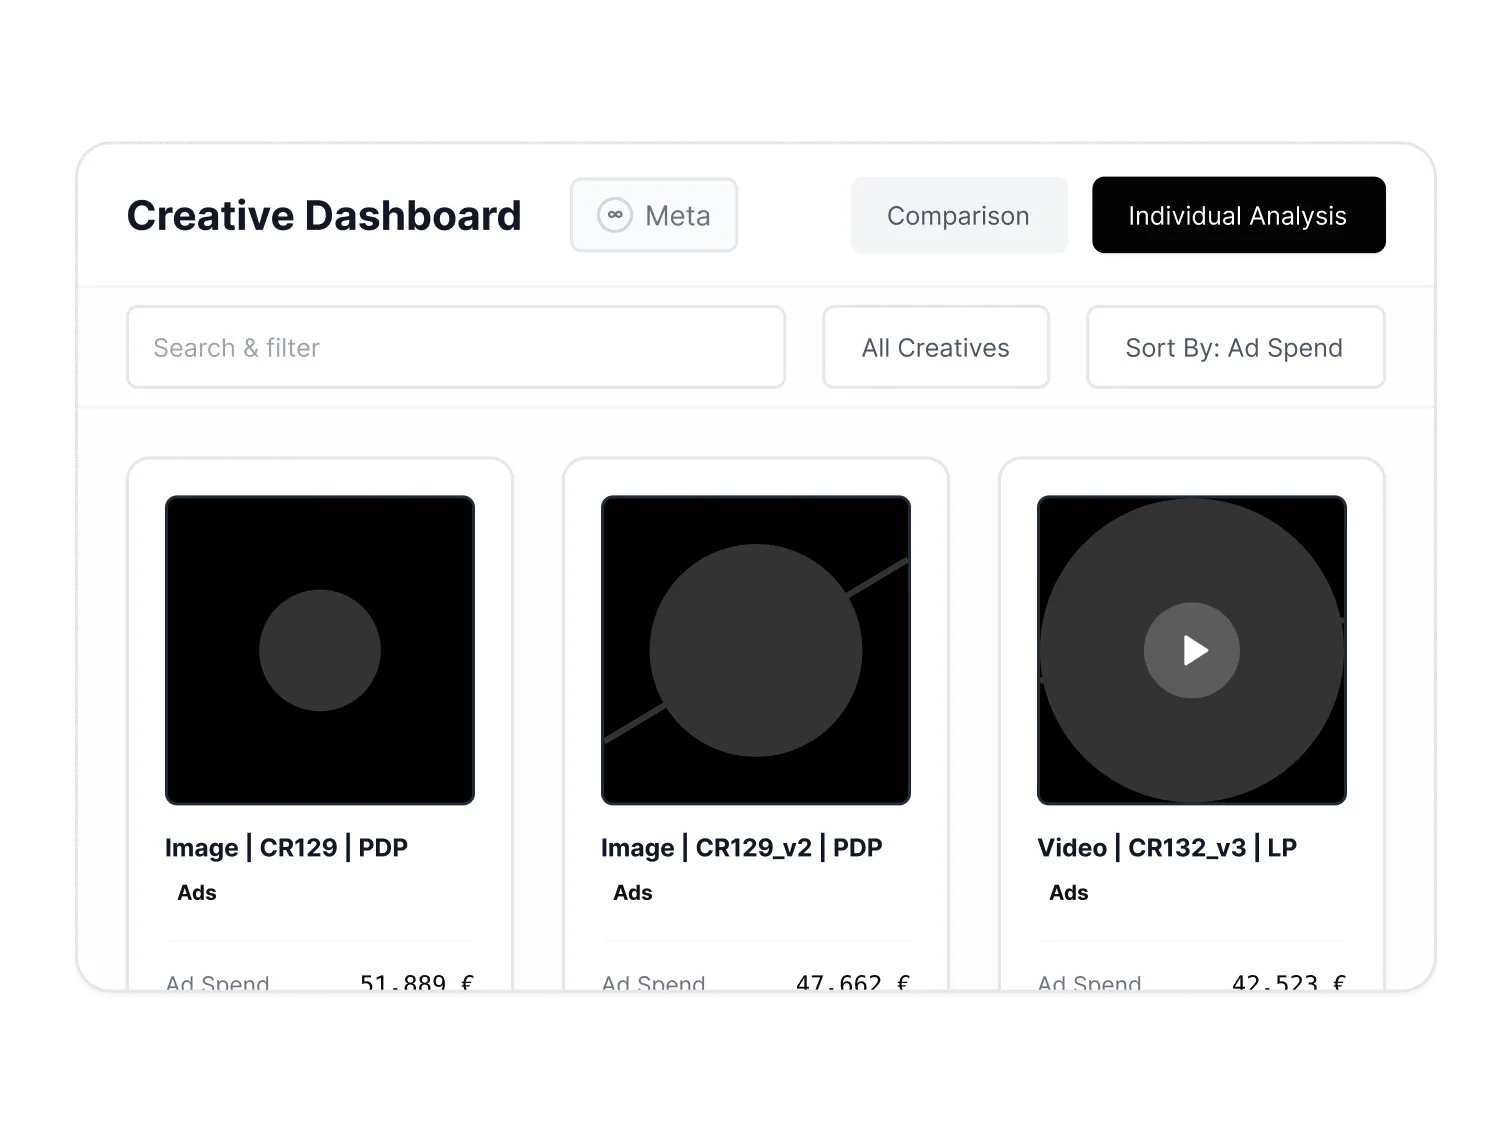
Feature

Creative Analysis Dashboard

With the Creative Dashboard, analyzing and iterating your advertising media is super easy and more precise. For example, by identifying which of your images and videos are working and which aren't. Or where trends are developing in selected campaigns. In doing so, you lay the foundation for a data-driven creative strategy.
"Wir konnten wieder deutlich mehr Learnings generieren, da wir Winner & Loser Ads eindeutig identifizieren können..."
Lukas
– CEO & Gründer bei myDartpfeil
Over 1000+ Managed Accounts
BLACKROLL brand logo.L'Osteria logo with white text on a red background.Casio brand logo in bold blue letters.Logo mit den weißen Buchstaben 'TC' auf einem roten Hintergrund.LUCKY BIKE Schriftzug als Logo in weiß auf schwarzem Hintergrund.Hannoversche logo with two blue slashes followed by bold navy blue text.

Have a look at this to learn more about this dashboard:

Visual KPI overview

Easily rate and compare your creatives with Meta (Facebook/Instagram) or TikTok to gain deeper insights into their individual performance and faster and more strategic decisions to meet.
Feature Image
Feature Image

Intuitive visual comparison

Dynamically compare and evaluate your creatives' performance metrics in visually intuitive bar or line charts. So Find the best ad creatives faster and easier.
Feature Image

Time-saving ad preview

Preview your ad creatives right on the dashboardinstead of constantly clicking back and forth between multiple monitors. That way, you can make decisions faster and focus directly on increasing your budgets or potential ad iterations.

Improved creative metrics

Get a holistic assessment of your creative performance with KPIs such asThumbstop Ratio, Average Watch Time, and Engagement. This helps you gain more context and supports you in your daily analysis.
Feature Image

Would you like to know more?
Book a demo now!

Book a demo with one of our marketing experts and find out what options are available for your online marketing.
I have read and agree to the privacy policy.
Thousands of performance
marketers rely on Tracify's data!
Oops! Something went wrong while submitting the form.
FAQ

Frequently asked questions

Still have questions?
Contact our support team.
Which metrics are available in the Creative Analysis dashboard?
arrow down

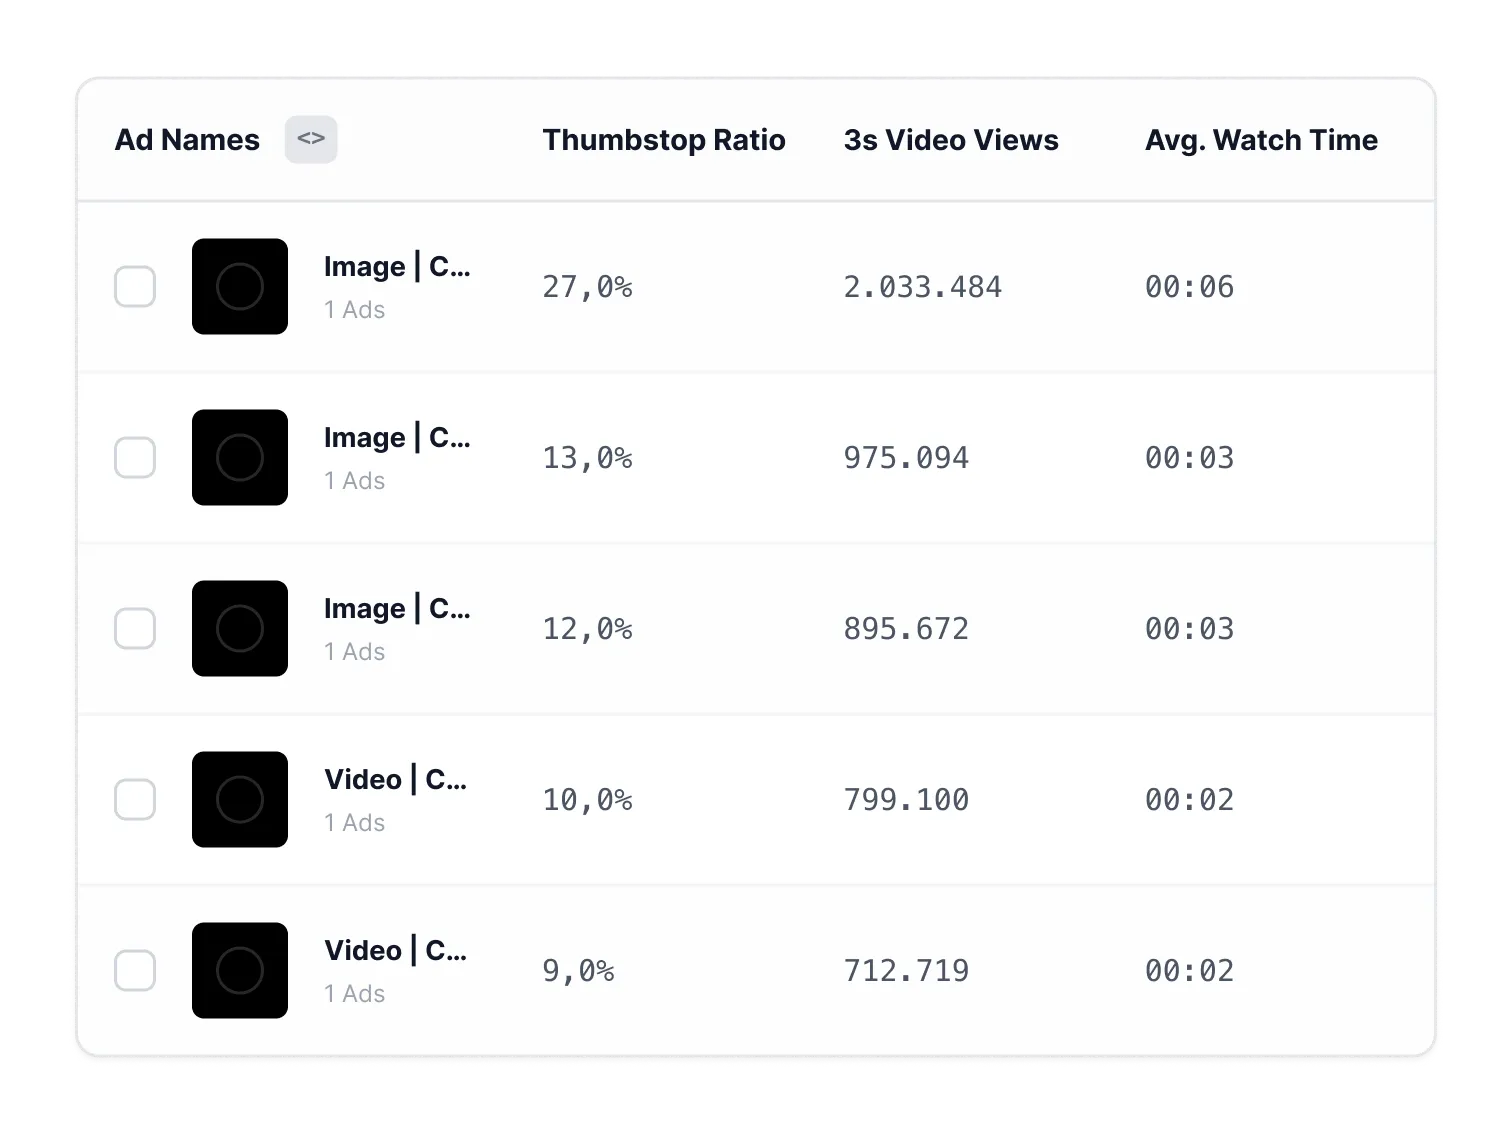
Alongside standard KPIs like ROAS and CPA, you get creative-specific metrics such as Thumbstop Ratio, Average Watch Time and Engagement. These help you clearly separate creatives that grab attention from those that actually convert.

Do I have to switch between Tracify and the Ads Manager to evaluate my creatives?
arrow down

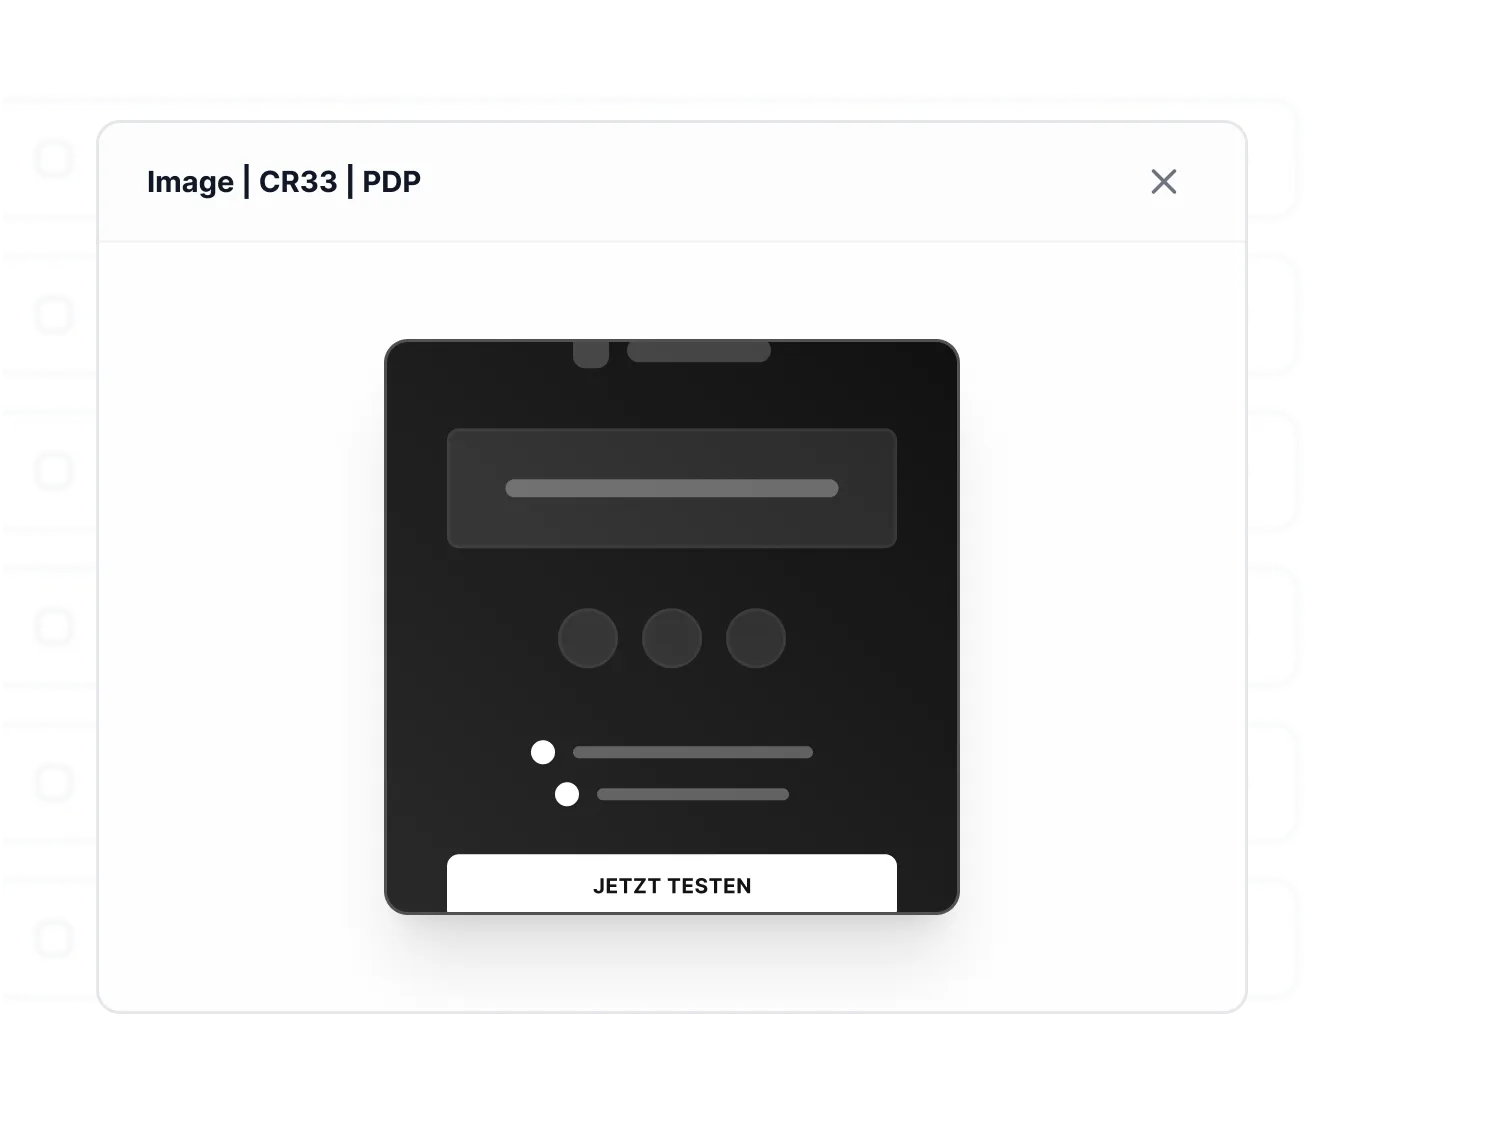
No. You can preview your ad creatives directly inside the Creative Analysis dashboard — without switching between monitors or tools. That saves analysis time and speeds up decisions on budget increases or creative iterations.

Can I compare creatives across channels?
arrow down

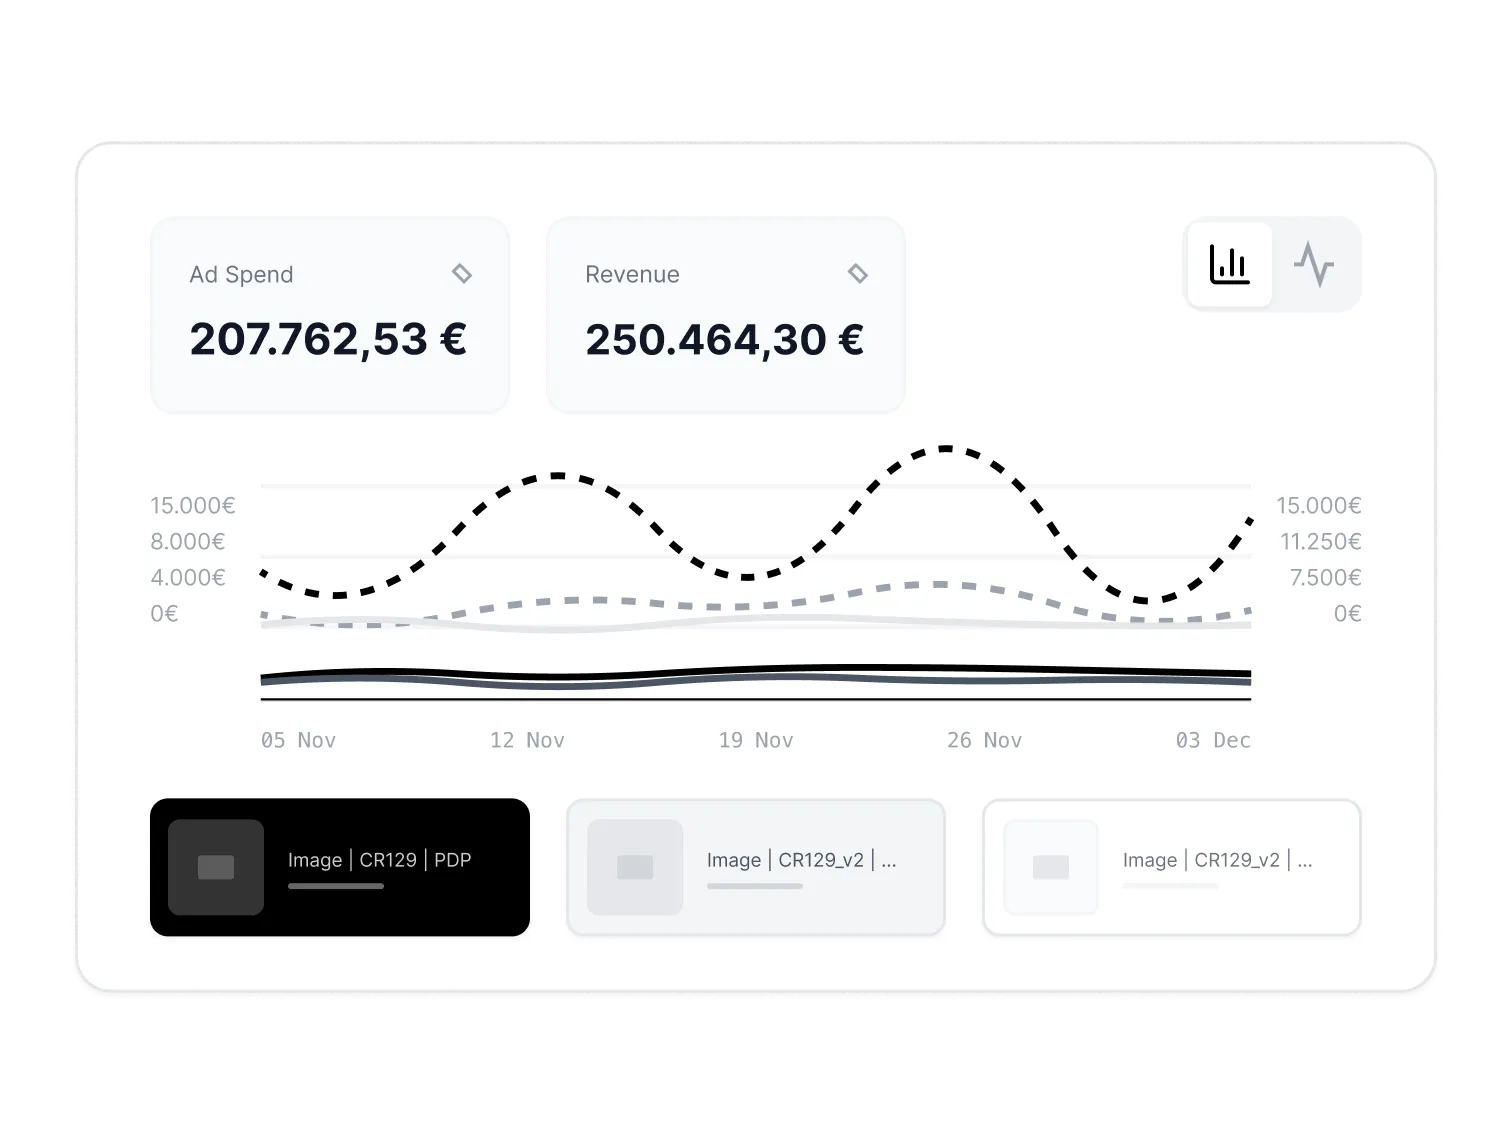
Yes. The dashboard lets you directly compare creatives across Meta (Facebook/Instagram) and TikTok in one unified interface — with visually intuitive bar and line charts for fast pattern recognition.